🌍 Map
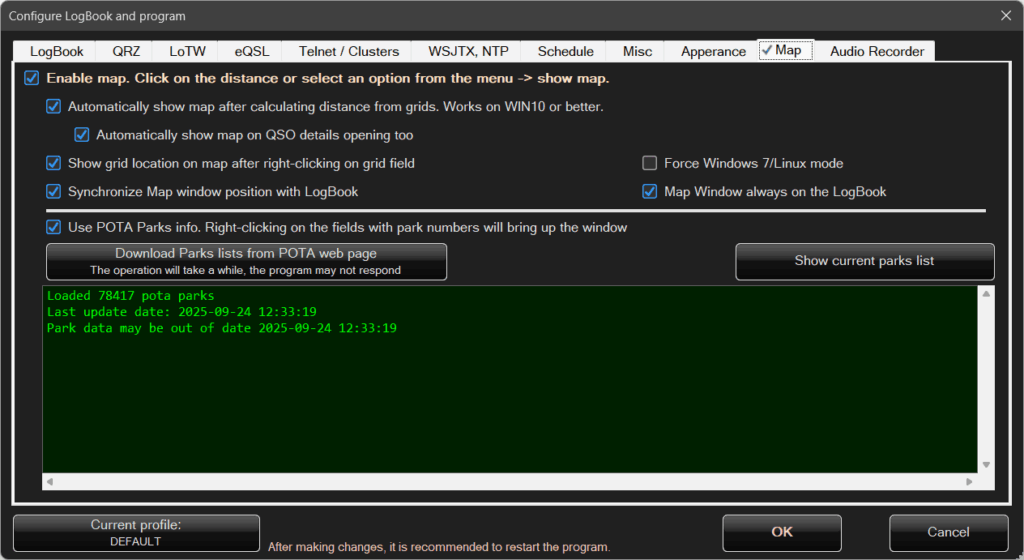
Here you configure the map settings:
The map can appear in various situations.
It can be displayed automatically or after clicking on the calculated distance.
The desired behavior can be selected by choosing the appropriate options in the configuration above.
On Windows 7, there may be issues with displaying maps.
Windows 7 does not support the WebView2 control based on the Edge browser.
Although it can theoretically be installed manually, tests have shown that it does not work reliably.
Wine — the environment used to run Windows applications on Linux — also has similar limitations.
The program detects Windows 7 / Wine, and additional information will be displayed in the upper-right corner of the configuration window:
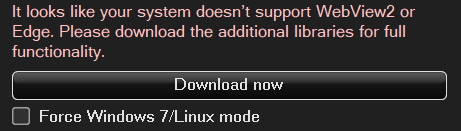
Click Download now to install the add-on required for map functionality.
Force Windows 7 / Linux compatibility mode can be useful if, for some reason, the program does not correctly detect that it is running on one of these systems.
This option can also be helpful on Windows systems with non-standard or stripped-down configurations.
If map display is not possible, simply click this button and download the map add-on.
To display maps, at least one valid grid locator is required.
Based on this grid, the program calculates the position on the map.
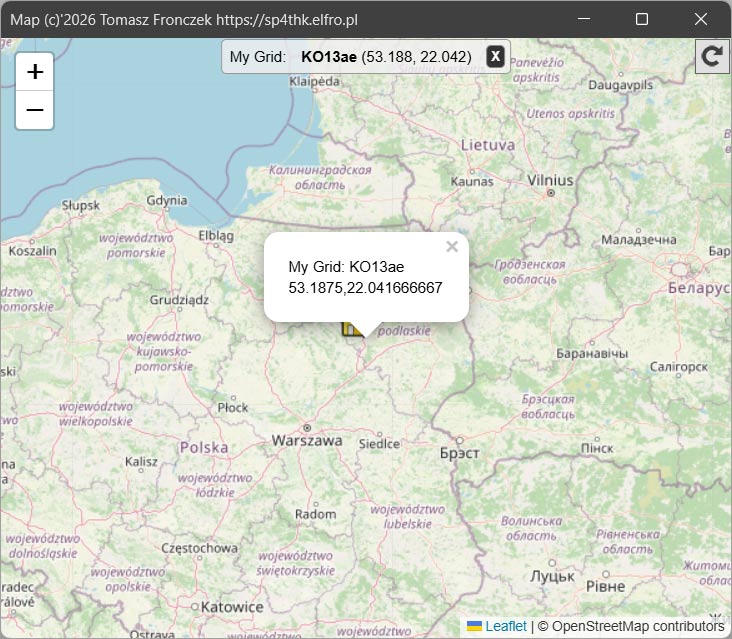
The map can be displayed in two modes:
- Single point – when data for only one callsign is available (one grid), or when you right-click a selected grid in the Logbook.
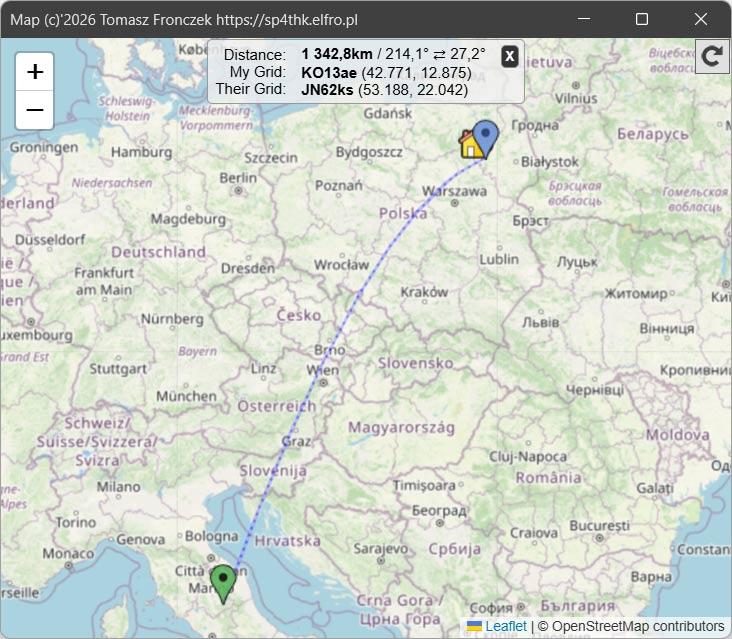
- Two points with distance shown – when both your grid and the correspondent’s grid are available, with the distance between them highlighted.
Examples of the two map types:
Selecting Synchronize map window position with the Logbook causes the map window to move together with the Logbook window.
This keeps the window layout aligned when the Logbook is moved.
🌳 Use park information in the POTA program
Right-clicking with the mouse will open a dedicated window.
The program can also display park information from the POTA program.
Park data is downloaded once and stored locally on disk. If a long time has passed, it is recommended to update it by clicking Download park list from POTA.
Why are park data downloaded once instead of being updated continuously?
While this might seem inconvenient, downloading both map data and park information puts a load on the internet connection — and during field activations, internet access is often very weak or unavailable.
By keeping the data offline, park information remains available even without an internet connection.
Using this feature is very simple.
Just right-click on your own park or the correspondent’s park.
If there is only one park, it will be displayed on the map immediately.
If there are multiple parks (your own, the correspondent’s, or multi-park operations), a selection window will appear:
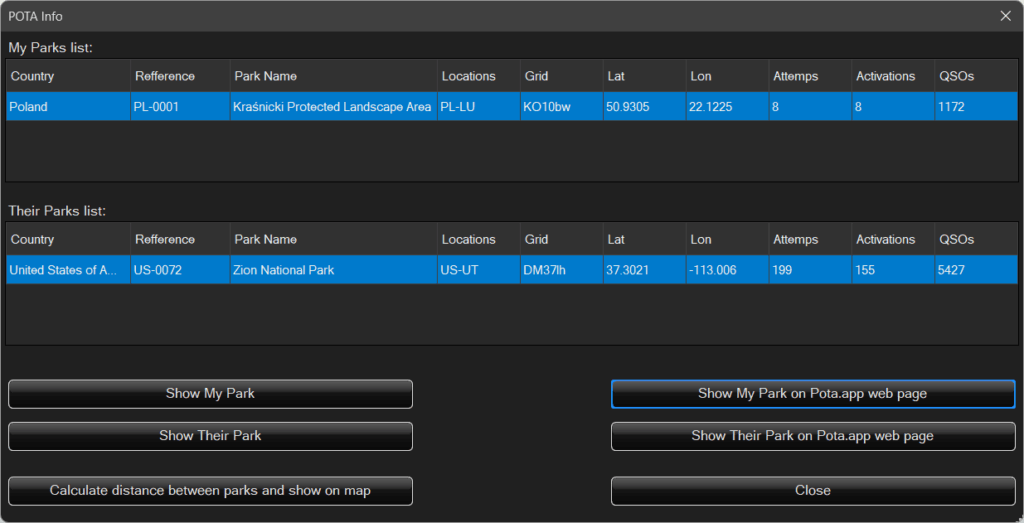
From this window, you can select the appropriate parks and view them on the map — for example, the distance between two parks.
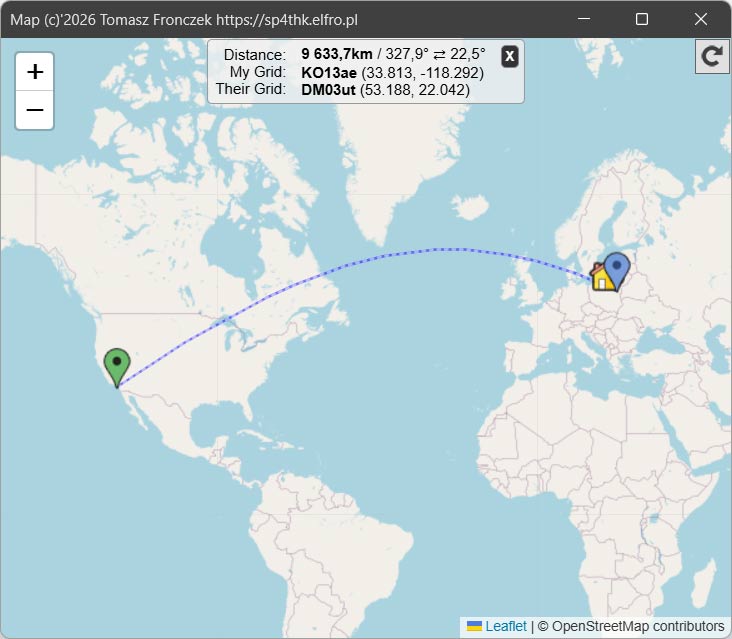
If both you and your correspondent each have one park, the map with the distance between them will be displayed automatically.
In addition to maps related to correspondents’ grids and parks, there are also other map features available.
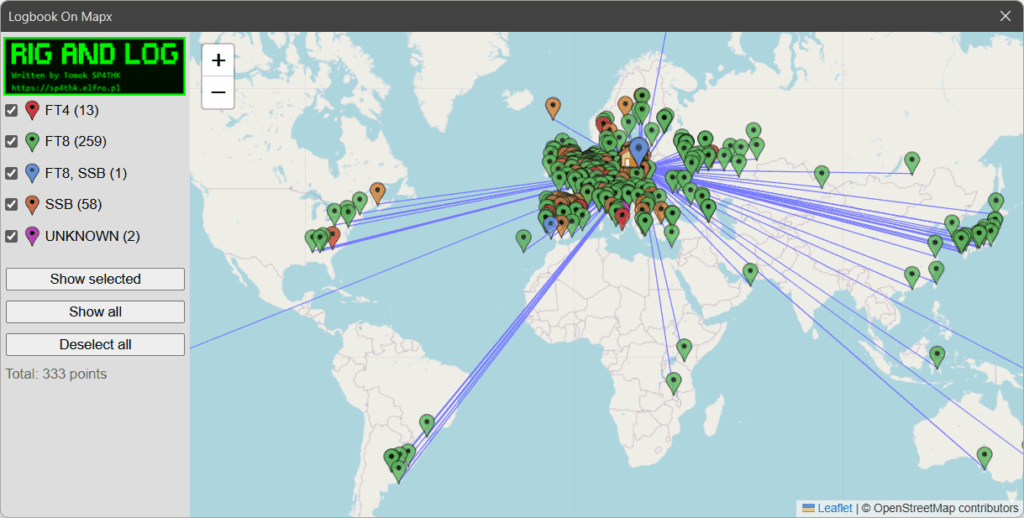
🌍 Show Logbook on the map
After selecting this option from the main Logbook Menu, a dialog window will appear:
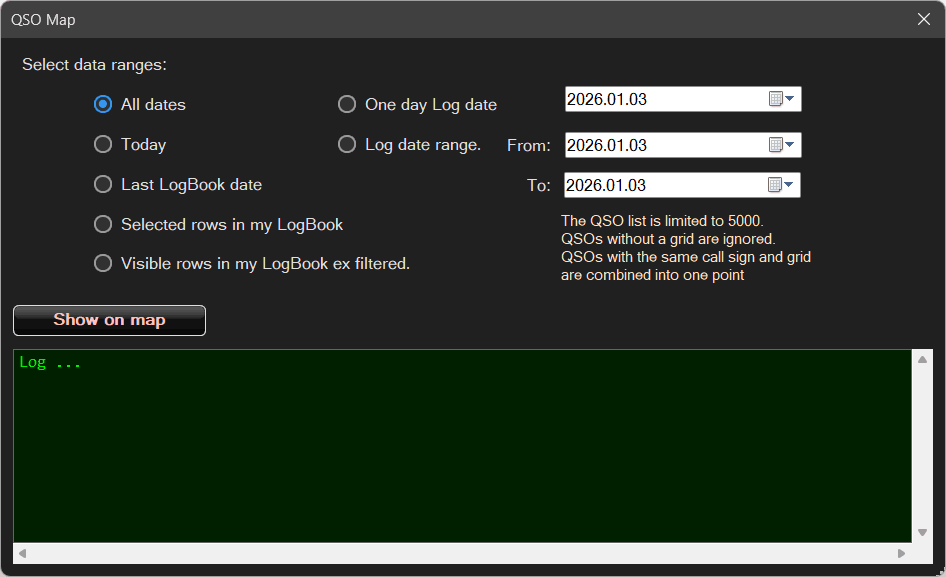
Here you can select the data range and then click Show on map:
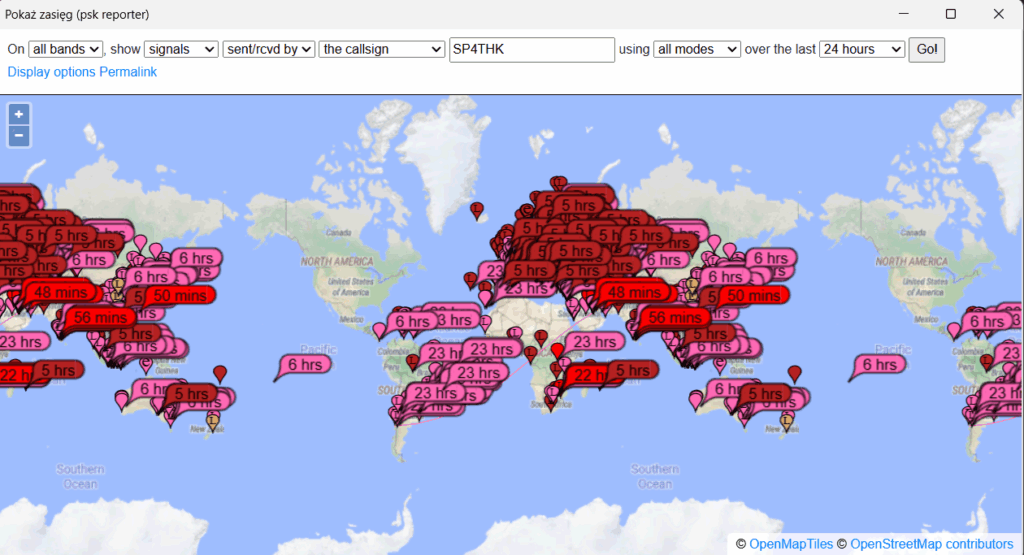
Show coverage (PSK Reporter)
When starting this feature for the first time, you need to configure what should be displayed.
Afterwards, the window looks like this:
🎙️ Audio Recording
The program can record and store audio from QSOs.
To do this, it must be properly connected to the radio, and the radio itself must send audio to the computer via an audio connector, USB, or another interface.
Radio configuration is not described here, as there are many options and radio models.
The program itself is easy to configure.
In the configuration window, select the Audio tab:
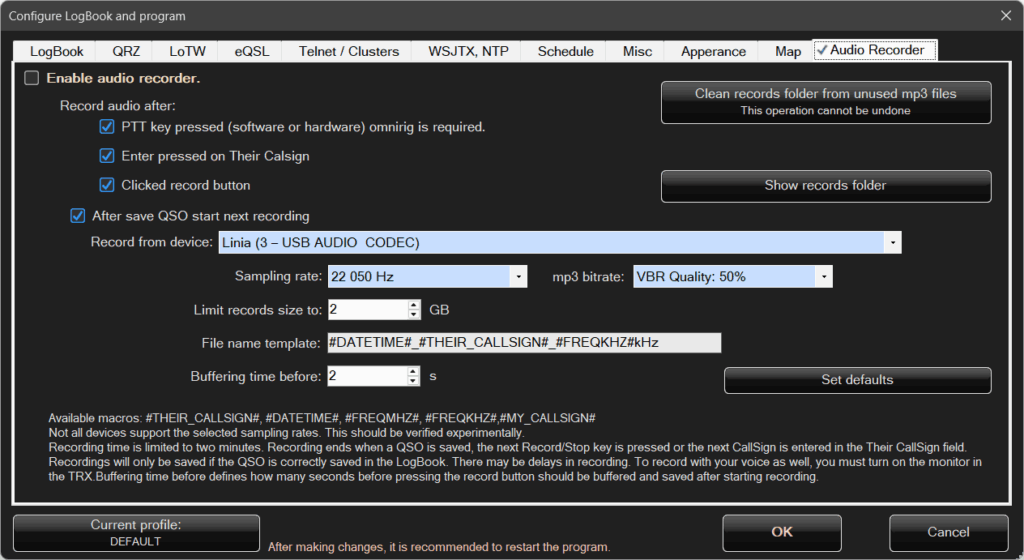
The program records audio in MP3 format, which reduces the amount of disk space used by recordings.
The configuration options are standard.
If you are unsure what to select, simply click Set default values.
After configuration, an icon will appear next to the correspondent’s callsign in the main Logbook window — highlighted with a red circle in the image below:
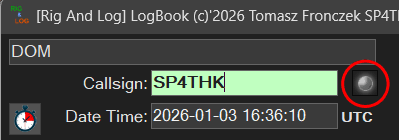
Right-clicking with the mouse will display a menu:
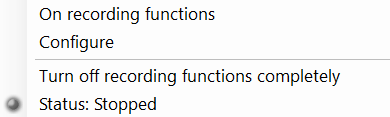
To enable recording, click Enable recording function — the program will start buffering audio data.
The icon will change its color to green.
This does not mean that recording has already started.
On the contrary — audio data is being buffered, and the program is waiting for the actual recording to begin, which can be triggered by events defined in the configuration.
When recording starts, the icon color will change to red.
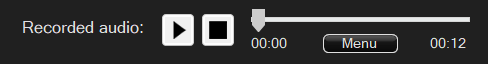
The recording will be attached to the QSO and can be played back in the details of the selected QSO.
🧩 Miscellaneous
This configuration tab contains other useful program settings:
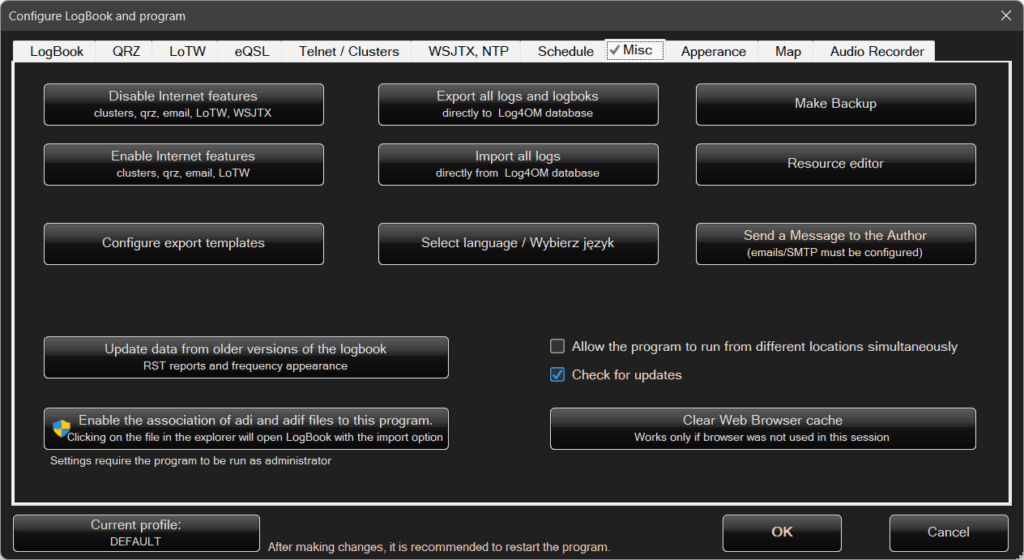
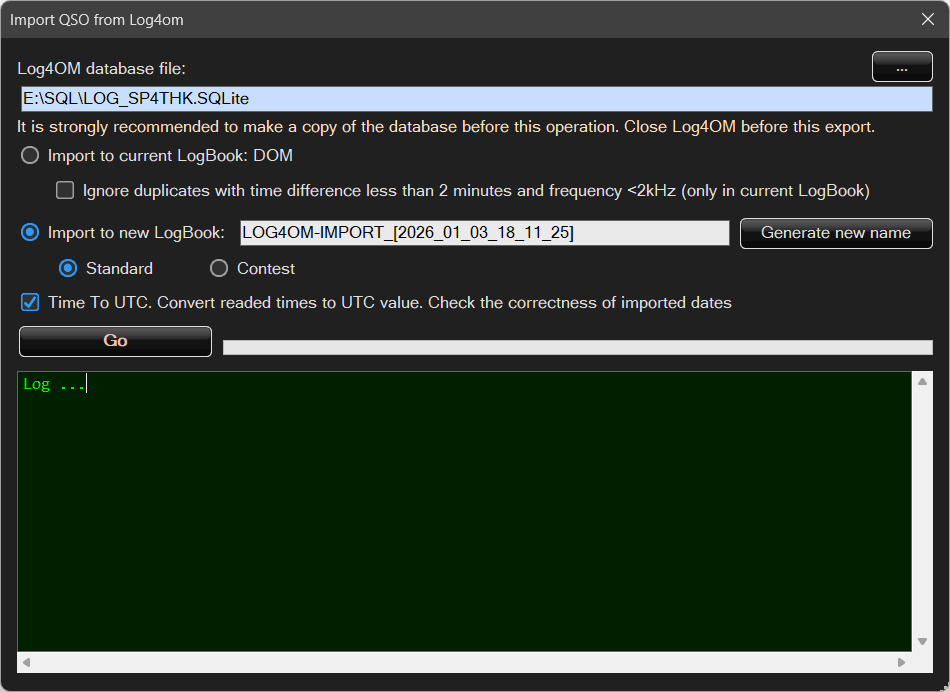
Here you can import logs from or export logs to the database of another logging program, Log4OM, directly.
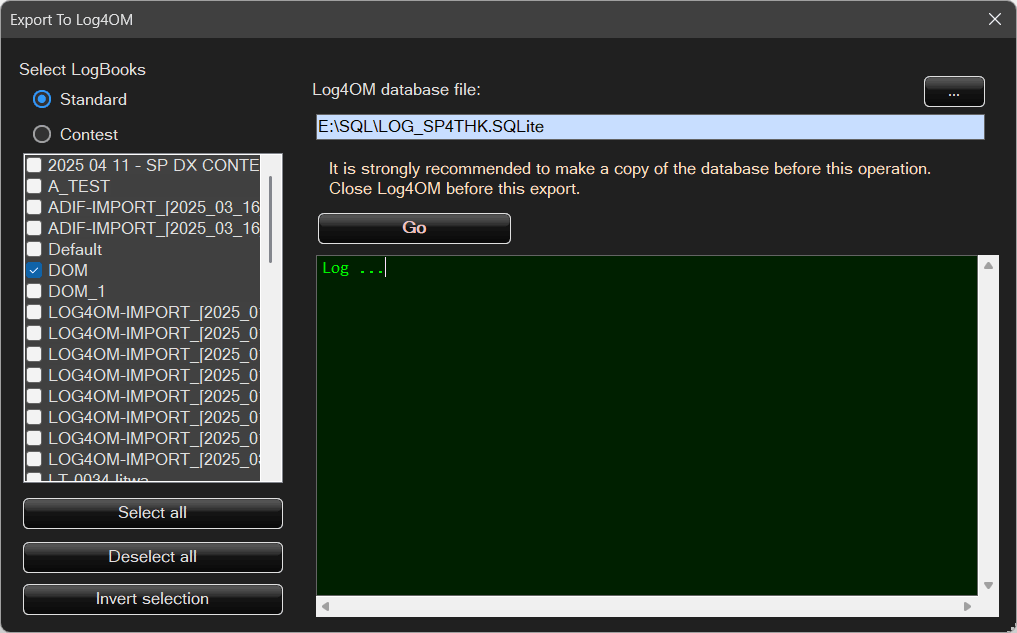
You can also create a data backup:
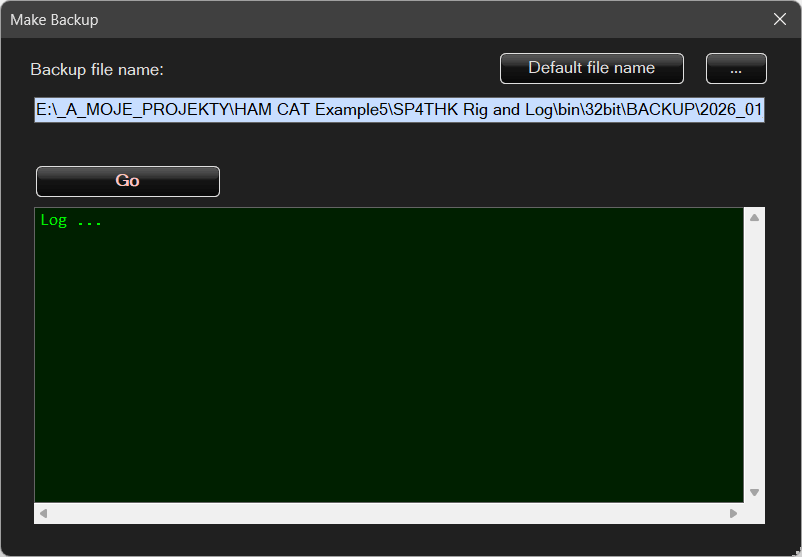
Data is saved in a standard ZIP file.
A backup can also be created simply by manually copying the entire program directory, for example to a USB flash drive.
This is undoubtedly an advantage — copying, moving, running the program from another location, or restoring it from a backup is completely straightforward.
The program is portable and does not require databases, special system folders, registry entries, or installation.
Update data from older Logbook versions – in earlier versions (at least 0.3.x), report data and frequency information were stored in a less optimal format.
Clicking this option converts the old format into the new, cleaner format.
Enable ADIF file association – this option enables file association in Windows, so that double-clicking any .adi file will start the Logbook and open the import dialog automatically.
🎨 Appearance
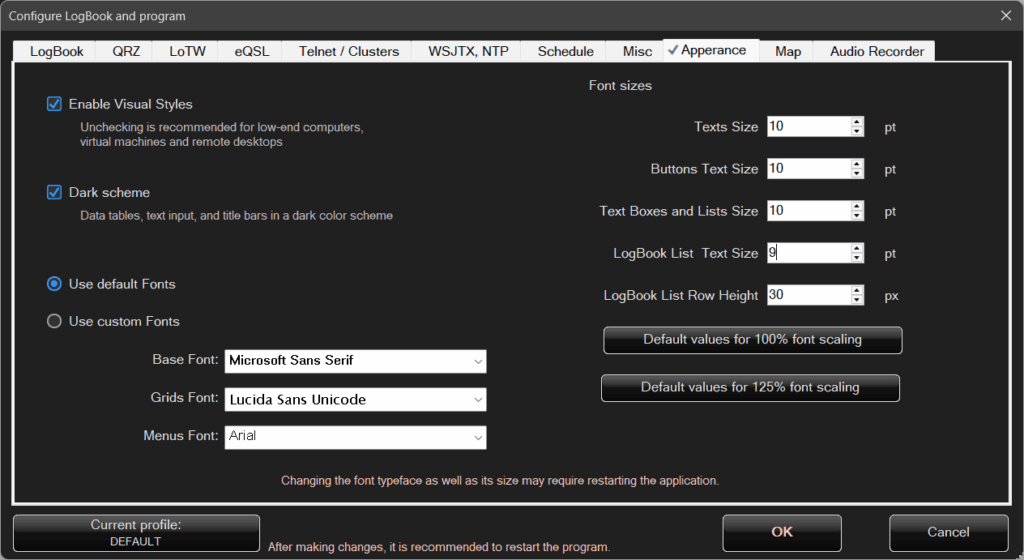
Here you can choose whether to enable or disable visual styles, such as button styling.
On very low-performance hardware or when using remote desktop, disabling visual styles may slightly improve performance and reduce resource usage.
You can also select a dark color scheme, as well as the font name and font size.
In the main Logbook tab of the program, there are also additional functions that have not yet been described:
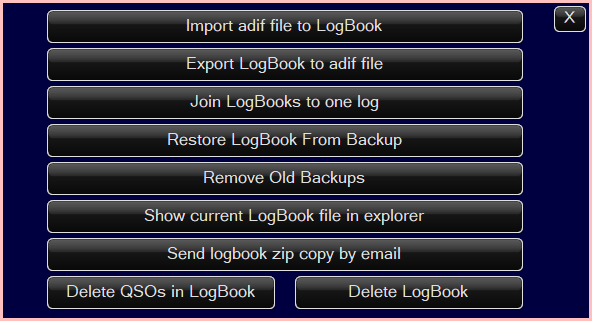
These are options related to Logbook management and maintenance.
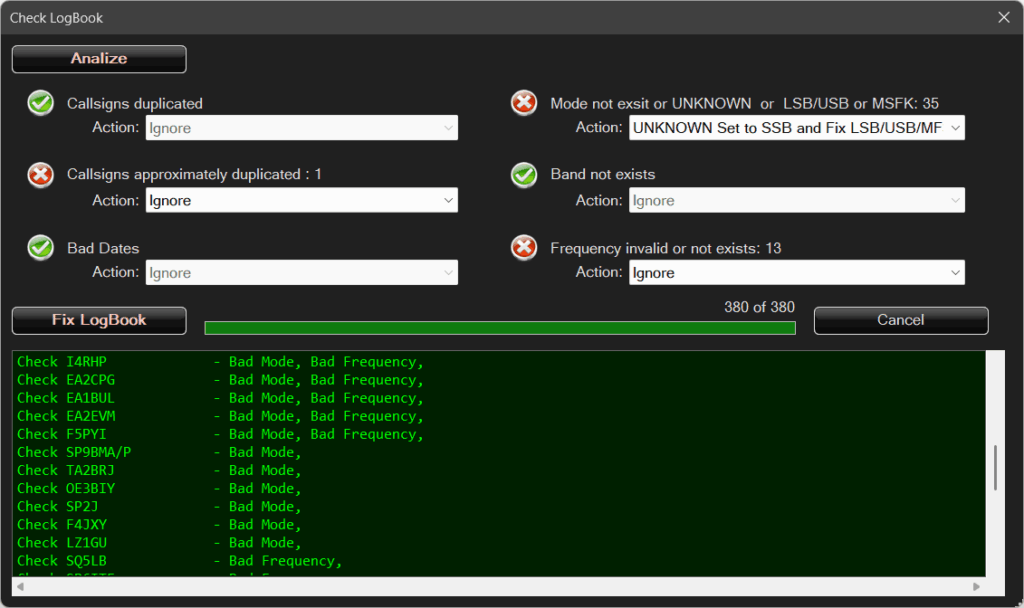
Check current Logbook – checks whether there are any errors in the logbook and allows you to choose how they should be fixed: